Electrical Companies Struggle To Find People As Power Demand Increases

Texas Power Lines
Texas Power Lines

As you can imagine, an influx of drilling in South Texas has meant an influx of new businesses and people. Businesses and people both consume electricity.

The pace of electrical capacity expansion in some oilfield areas has increased to 10-times more than it was in the three year period before the oilfield boom kicked off.

The electrical industry is facing hurdles of its own. It is not cheap to build out distribution in what was once sparsely populated areas. Utilities have to compete for people with other South Texas oilfield jobs. That makes it difficult to find and keep qualified people.

Also, land owners demand premium prices for right-of-way and electrical companies prefer not to use eminent domain. Instead, they pay a little more and avoid the legal process.

“You can just see the exponential growth in the transformer infrastructure and capacity,” said Robert Knowles with AEP Texas.

Read more in regard to electrical demand in rural oil areas at mysa.com

Natural Gas Exports & Global Gas Prices

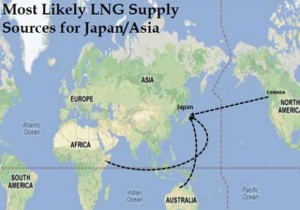
Japan and Asia LNG Supply

Shale exploration technologies have initiated a renaissance for domestic applications for natural gas that include power generation, manufacturing and vehicle fuel, but also the growing prospect for export. Yet the possibility of exporting natural gas remains controversial. For example, several chemical companies have formed an advocacy group known as America’s Energy Advantage that is attempting to exert political pressure to limit exports.

Exporting Domestic Natural Gas Is Attractive At International Prices

It’s not hard to see why exporting natural gas is an attractive proposition. At present, global natural gas markets are not integrated. Prices vary from $0.75 per thousand cubic feet in Saudi Arabia, to $3-4 in the U.S. to around $12 in Europe, and as high as $16-17 in Japan. This situation is based on short-term shifts in supply and demand which have created export arbitrage opportunities,[1] which will be systematically exploited.

LNG Liquefaction Needed

In order to ship natural gas abroad from the U.S. efficiently, it must be supercooled to minus 260 degrees Fahrenheit near an export terminal at a deepwater port and transformed into LNG, which reduces its volume by more than 600 times. An LNG tanker then transports the product to its designated foreign market. When the LNG reaches its destination, it is revaporized (or regasified) back into a gas before being shipped to its final destination by pipeline. Each step in this process is significant in terms of operating costs.[2]

“Given the current worldwide price differentials, it is profitable to ship LNG to Japan from the U.S.”

 For example, given the current worldwide price differentials, it is profitable to ship LNG to Japan from the U.S. Assuming a U.S. market price of $4 per thousand cubic feet, there is the additional cost of approximately $6.40 to liquefy, transport and regasify at the delivery point in Japan – more than doubling the price. Even so, a healthy profit of $6.60 for every thousand cubic feet is still generated.[3] However, this lucrative opportunity will not go unnoticed by Australian, East African and even Canadian natural gas suppliers – all of whom have substantial natural gas reserves and are equally or better positioned logistically to ship to Japan than is the U.S.

Similarly, prices in Europe have remained artificially high because of Russia’s Gazprom monopoly on natural gas exports. With the threat of LNG imports from the U.S., the Ukraine and other countries[4], prices in Europe are unlikely to remain at current levels either. Further, Gazprom’s pipeline monopoly is already under siege from domestic producers in Russia, such as Novatek and Rosneft, and Statoil in Norway.[5]

In short, markets are dynamic. While there is an attractive export opportunity in the near term (3-5 years) for U.S. producers, over the longer term supply will catch up with demand and reduce global price differentials.[6]

A Global Market For Natural Gas Will Evolve

[ic-l]The eventual synchronization of supply and demand will serve to both moderate the demand for exports from the U.S., as well as put downward pressure on natural gas prices.[7] In the same way that crude oil has become a global market, so will natural gas. This will come about as a direct result of new, significant natural gas discoveries and eventual production in the U.S., Australia, East Africa and probably China – perhaps other countries as well. These countries will seek to export their surplus, or in the case of China, reduce their need to import. Taken as a whole, these new supply markets that extend well beyond U.S. borders will serve to keep a cap on natural gas prices at an estimated $4-7 per thousand cubic feet (and arguably in a tighter range between $5-6).[8] This kind of price stability would indeed represent a significant shift away from the frequent spikes that occurred during the era of conventional natural gas exploration and production, which is steadily giving way to unconventional methods of production.

[1] Energy Information Administration. “Effect of Increased Natural Gas Exports on Domestic Energy Markets.” U.S. Department of Energy. January 2012.

[2] Kawamoto, Lt. Hannah. “Natural Gas Regasification Technologies,” USCG Proceedings, Winter 2008-09.

[3] Henderson, James. “The Potential Impact of North American LNG Exports.” The Oxford Institute for Energy Studies.

[4] Peaple, Andrew. “A New Foreign Policy for Gazprom.” Heard on the Street,The Wall Street Journal. January 29, 2013.

[5] Marson, James. “Gazprom warns of a drop in profit, driving down stock” The Wall Street Journal. Feburary 11, 2013.

[6] Medlock III, Ph.D., Kenneth B., “U.S. LNG Exports: Truth and Consequence.” James A. Baker III Institute for Public Policy, Rice University. August 2012.

[7] Henderson, James. “The Potential Impact of North American LNG Exports.” The Oxford Institute for Energy Studies, from the Preface by Howard Rogers.

[8] Henderson, James. “The Potential Impact of North American LNG Exports.” The Oxford Institute for Energy Studies and UTSA Center for Community and Business Research estimates.

Eagle Ford Counties See Sales Tax Receipts Rise Almost 10 Fold

Since Petrohawk's Eagle Ford discovery in 2008, sales tax receipts in local counties have boomed to the tune of almost ten times more than five years ago. The revenue has been more than welcomed in local communities. State Impact took a deeper look at a sample of five counties: Atascosa, Dimmit, Gonzales, Karnes, and Live Oak.

“In 2008, the five counties collected an average of nearly $650,000 in sales taxes. But just four years after drilling started, the yearly average for those same counties jumped to over $5.8 million.”

Read the rest of the story at stateimpact.org

Eagle Ford Regional Rig Count 261 on June 28, 2013

Eagle Ford Shale Well Map

The Eagle Ford Shale drilling rig count fell by two rigs to 261 running over the past week. Every week there are rigs in transit to the next location or waiting to begin drilling. Those rigs are not counted in the census, so somewhere around 5-10 rigs are not included. A change of just two in one week really doesn't tell us much. We've floated just above 206 rigs for the entire year and we won't likely see any major changes unless oil prices breakout of the $90-100/bbl range.

The U.S. rig count fell 11 rigs to 1,748 rigs running, of which 832 are running in Texas. A total of 353 rigs are targeting natural gas and 1,390 are targeting oil in the U.S. The remainder are drilling service wells (e.g. disposal wells, injection wells, etc.).

We shared the new TX RRC Eagle Ford well map on the site this week. It's obvious natural gas prices have been better and significant processing has come online in the first half of 2013. The natural gas producing well count has increased by almost 50% from less than 1,000 wells to almost 1,500. Read more in the article Eagle Ford Shale Well Map - TX RRC May 2013

It's also of note that while natural gas prices were increasing, rigs were moving from oil prone to more gas prone areas of the play. For example, the rig count in Karnes County grew to a 2013 peak of 39 rigs in mid-May. That was up from 23 rigs in mid-February. That trend has reversed as natural gas prices have fallen over the past several weeks. Prices hit a peak of $4.40/mmbtu in April have been on a path to ~$3.50 since. The Karnes County rig count has followed and there are nine less rigs running (30) than we saw at the peak.

*Note* Now quoting Baker Hughes. Baker Hughes also releases its own Eagle Ford Rig Count that covers the 14 core counties (~230 rigs). Our numbers cover a 30 county area impacted by Eagle Ford development. A full list of the counties included can be found in the table at the bottom of this article.

Eagle Ford Oil & Gas Rigs

[ic-l]The natural gas rig count in the region gave three rigs back to fall to a total of 30 running. Natural gas futures fell $0.20 on the week to close near $3.59/mmbtu on Friday afternoon. That's a significant drop from the high of $4.40/mmbtu we saw in April.

One more or 230 oil rigs are running in the region this week. WTI futures rebounded with the broader equity markets during the week and ended near $97/bbl on Friday. Eagle Ford light crude traded at $93.50/bbl on June 27th.

McMullen & Karnes counties lead development with 31 and 30 rigs running, respectively. See the full list of drilling by county below.

South Texas Oil & Gas News:

Be sure to visit our South Texas Oilfield Job Listings to search openings and come back weekly for updates.

Eagle Ford Shale Drilling by County

agle Ford Operated Rig Count By Company

SmithBits no longer reports its operated rig count, but we'll have updated number for you from a new source soon. Until then, you can reference our numbers from mid-April. There has not been a significant change in the overall rig count since this date:

What is the Rig Count?

The Eagle Ford Shale Rig Count is an index of the total number of oil & gas drilling rigs running across a 30 county area in South Texas. The South Texas rigs referred to in this article are for ALL drilling reported by Baker Hughes and not solely wells targeting the Eagle Ford formation. All land rigs and onshore rig data shown here are based upon industry estimates provided by the Baker Hughes Rig Count and/or Smith Service Co's (Schlumberger) Smith Rig Count.

Freeport LNG Looking For Financing - Planning Gas Exports

Freeport TX LNG
Freeport TX LNG

Freeport LNG is looking to raise more than $7.5 billion to begin construction at its proposed LNG export facility in Freeport, TX.

The Energy Department has approved 1.4 Bcfd in exports at the site and the company is seeking approval for an additional 1.4 Bcfd. The facility still needs FERC approval and expects to know more in 2014. If everything goes as planned, one export train a year will come online starting in 2017.

The Freeport LNG facility has agreements to export gas for Osaka Gas, Chubu Electric Power, and BP.

Cheniere Energy is the only LNG export facility to receive full approval to export US natural gas. The Cheniere facility is located at Sabine Pass and construction started in August of 2012.

Production continues to grow in what are historically consuming areas like the Marcellus Shale. If production continues to grow in the Northeast, exports will be a welcomed market for Eagle Ford gas. Exports might even be needed to support any significant amount of natural gas development.