
Clayton Williams Sells Eagle Ford and Austin Chalk Acreage for $71 Million

Clayton Williams Eagle Ford Acreage Map

Clayton Williams Energy sold some of its Eagle Ford and Austin Chalk wells and leases in a $71 million dollar deal in March 2014. The sale included acreage and selected wells in Wilson, Brazos, LaSalle, Frio and Robertson Counties.

In 2013, Clayton Williams grew its Eagle Ford oil production by ~430% in the fourth quarter of 2013 to 1,354 b/d. Only about 5% of the company's oil and gas production for the fourth-quarter came from the divested properties.

Read more: Clayton Williams Grew Eagle Ford Oil Production ~430% in Fourth-Quarter of 2013

The assets included in the sale only made up ~2% of the company's total proved reserves at the end of 2013, and are located outside the company's core block of Austin Chalk and Eagle Ford acreage. Net proceeds from the sale will be used to pay for outstanding debt and fund a portion of the company's capital expenditures for 2014.

In a company statement released by Clayton Williams, a buyer for these properties wasn't disclosed.

Clayton Williams Acreage Deal Highlights

  • Clayton Williams sells Eagle Ford and Austin Chalk properties for $71 Million to an undisclosed buyer in March 2014
  • Only ~5% of the company's oil and gas production for Q4 2013 came from divested properties
  • Sold properties only made up ~2% of the company's total proved reserves in 2013
  • Proceeds from sale will be directed to the 2014 capex budget and debt re-payments

Read more at claytonwilliams.com
Eagle Ford Rig Count - 267 - EIA Data Shows Play is a Top Oil Producer

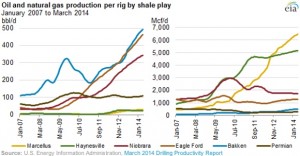
EIA Oil and Gas Production Per Rig

The Eagle Ford Shale rig count stayed flat at 267 rigs running over the past week.

In recent news, U.S. Energy Information Administration (EIA) data released in March 2014, shows each drilling rig in the Eagle Ford Shale will contribute 400 b/d more than it would have in the same formation in January 2007. Total April 2014 oil production in the Ealge Ford is expected to be 1,359,000 b/d. Total natural gas production in the Eagle Ford is expected to be 6,566 mcf/d.

Read more: Eagle Ford Leads the Pack in Oil Production Per Well - EIA

The U.S. rig count decreased by 17 to 1809 rigs running over the past week. A total of 344 rigs are targeting natural gas (1 less than last week) and 1,461 are targeting oil in the U.S. (18 more than last week). The remainder are drilling service wells (e.g. disposal wells, injection wells, etc.). 868or ~48% of rigs active in the U.S. are running in Texas.

Baker Hughes rig count is quoted here. Baker Hughes also releases its own Eagle Ford Rig Count that covers the 14 core counties (224 rigs). The rig count published on EagleFordShale.com includes a 30 county area impacted by Eagle Ford development. A full list of the counties included can be found in the table near the bottom of this article.

Eagle Ford Oil & Gas Rigs

The natural gas rig count decreased by 5 rigs to 267 running this past week. Average rig counts for natural gas production in 2012 were around 82 and then dropped to around 41 in 2013. Over the past week, natural gas decreased to $4.38/mmbtu on Friday afternoon.

The oil rig count increased by 5 to 229 rigs running. WTI oil prices decreased, trading at ~$99/bbl by the end of the week. Eagle Ford light crude traded at $94.75/bbl on March 13th.

A total of 234 rigs are drilling horizontal wells, 20 rigs are drilling directional wells, and 13 rigs are drilling true vertical wells. Karnes, La Salle, Dimmit, McMullen and Webb counties each have at minimum 24 rigs running. Karnes County has the highest rig count this week at 35. See the full list below in the Eagle Ford Shale Drilling by County:

South Texas Oil & Gas News:

Be sure to visit our South Texas Oilfield Job Listings to search openings and come back weekly for updates.

Eagle Ford Shale Drilling by County

Eagle Ford Operated Rig Count By Company

SmithBits no longer reports its operated rig count, but we'll have updated number for you from a new source soon. Until then, you can reference our numbers from mid-April. There has not been a significant change in the overall rig count since this date:

What is the Rig Count?

The Eagle Ford Shale Rig Count is an index of the total number of oil & gas drilling rigs running across a 30 county area in South Texas. The South Texas rigs referred to in this article are for ALL drilling reported by Baker Hughes and not solely wells targeting the Eagle Ford formation. All land rigs and onshore rig data shown here are based upon industry estimates provided by the Baker Hughes Rig Count and/or Smith Service Co's (Schlumberger) Smith Rig Count.

Matador Resources Oil Production Up 76% Company-Wide Due to Eagle Ford

Matador Drilling Graph

Matador Resources had a 76% increase in oil production across its portfolio in 2013 from 3,317 b/d  - 5,843 b/d. The increase was a direct result of the company's drilling operations in the Eagle Ford Shale. In 2013, Eagle Ford production also contributed ~14.9 mmcf/d, which was ~42% of the company's total natural gas production.

Matador continues to have solid results in the Eagle Ford. Look for the company to make some acreage deals in the play this year.

Matador's Eagle Ford budget for 2014 is $318 million.

Read more: Matador Eagle Ford Capital Budget - $318 Million in 2014

Matador Eagle Ford Operations in 2013

During 2013, Matador completed and began producing oil and natural gas from 32 gross (27.6 net) Eagle Ford wells, including 25 gross (25.0 net) operated and 7 gross (2.6 net) non-operated wells. In the fourth-quarter, the Company completed and began producing oil and natural gas from 9 gross (9.0 net) operated and 3 gross (1.1 net) non-operated wells.

Drilling and completion costs went down in 2013, and are connected to refinements in the company's fracking treatments.

“Drilling times and overall well costs have continued to improve in the Eagle Ford, and several recent wells on our western acreage in La Salle County in South Texas have been drilled in as few as eight days from spud to total depth with total drilling and completion costs at or below $6 million. The latest generation of our fracture treatment design, whereby we are pumping more fluid and more proppant while using more perforation clusters and tighter fracture spacing, is also resulting in better well performance, as compared to offsetting wells treated with earlier generation fracture treatment designs. Overall, our operations group is continuing to deliver better wells for less money in the Eagle Ford.”
— Matador CEO, Jospeh Foran

Matador is also seeing positive results from downspacing. To date, the company has now drilled seven 40 to 50-acre spaced wells on its central acreage in Karnes County. Two of these wells flowed at approximately 1,100 to 1,200 boe/d (almost 90% oil), making them two of the best wells drilled by Matador in this area.

Read more at matadorresources.com

Eagle Ford Leads the Pack in Oil Production Per Well - EIA

EIA Oil and Gas Production Per Rig

According to the U.S. Energy Information Administration (EIA), the Eagle Ford Shale leads the pack in increased oil production per rig, compared to six other significant U.S. domestic shale plays. The data highlighting this milestone was released in March 2014.

Read more: An Eagle Ford Rig Adds 400 Barrels of Oil Production Per Month

In April 2014, EIA data shows each drilling rig in the Eagle Ford Shale will contribute 400 b/d more than it would have in the same formation in January 2007. Total April 2014 oil production in the Ealge Ford is expected to be 1,359,000 b/d. Total natural gas production in the Eagle Ford is expected to be 6,566 mcf/d.

Five of the six U.S. shale formations tracked by the EIA have seen increases in oil and natural gas production per rig over the past few years. The Eagle Ford, Bakken and Niobrara have all seen significant increase in oil production, while the Marcellus and Haynesville have seen increases in natural gas. The EIA credits horizontal drilling and hydraulic fracking for the increases in production.

“The productivity of oil and natural gas wells is steadily increasing in many basins across the United States because of the increasing precision and efficiency of horizontal drilling and hydraulic fracturing in oil and natural gas extraction. The geology of each oil and natural gas resource play is diverse, and individual rig or well performance can vary dramatically. However, drilling activity in U.S. shale plays is now generally producing greater quantities of oil and/or natural gas than in the past.”
— EIA

Advancements in technology highlighted by the EIA in their report are pushing the U.S. towards energy independence. The EIA's most recent Annual Energy Outlook forecasts U.S. oil production will reach 9,600,000 b/d in 2019. Natural gas production will increase 56% through 2040.

Read more at eia.gov

Clayton Williams Grew Eagle Ford Oil Production ~430% in Fourth-Quarter of 2013

Clayton Williams Eagle Ford Acreage Map

Clayton Williams Energy grew its Eagle Ford oil production in the fourth quarter of 2013 over 2012 by ~430% from 312 b/d - 1,354 b/d.

The increase in production is a sign that the company is gaining confidence in moving forward with its Eagle Ford operations. In an early February 2013 statement, the company alluded that additional drilling and production data would be needed to determine if the Eagle Ford Shale drilling program could be economically viable.

Clayton Williams Reserve Additions in 2013

In 2013, the Eagle Ford contributed to 27.7 mmboe of reserves additions in 2013. Other plays that contributed to Clayton Williams' reserve additions included the Wolfberry and Delaware Basin.

Clayton Williams Eagle Ford Guidance for 2014

Planned expenditures in the Eagle Ford formations account for ~$160 million. That's ~50% of the company's budget for the year. As of late February, the company had 2 rigs in its Giddings - Eagle Ford Shale drilling program.

Clayton Williams Eagle Ford Production Breakdown in Q4 2013

  • Oil - 1,354 b/d
  • Natural Gas - 86 mcf/d
  • NGLs - 20 b/d

Clayton Williams Eagle Ford Production Breakdown for 2013

  • Oil - 1,136 b/d
  • Natural Gas - 78 mcf/d
  • NGLs - 19 b/d

Read more at claytonwilliams.com